

Thoughts on the Week
Whatever it takes...but the other way round.

What a quarter! The role of policymakers, beyond their stated objectives/mandates, is to create a sense of calm so that the private sector can go about its business. This is exactly the opposite of what happened in Q1-2022, and the result was violence - not just in Ukraine, but in commodities and bond markets. While I would like nothing more than for this conflict to cease, I don’t understand geopolitics well enough to speculate on the outcome. So let’s talk about the yield curve :)
For better or worse, central banks operate using forward guidance - which is an attempt to guide markets about the path of policy, in a way that keeps financial conditions in line with what’s needed to keep inflation close to 2%. Generally, markets are a bit more optimistic than the central bank on the prospects of the economy, resulting in a constant, mean-reverting dance between market pricing and forward guidance. This time, however, the central bank - the Fed - decided to mark their views to the market (by adjusting their ‘dots’ to reflect what the market expected), as inflation refused to die ease.

And thus, we ended up with QE stopped sooner than previously expected, the time gap between the end of QE and the first hike eliminated, the gap between the first hike and QT all but eliminated, and a (25bps) hike projected at every meeting of the year, causing an explosion in fronts and inversion in the yield curve. The Fed went from ‘we may need one or two hikes by late 2022’ to ‘how about seven to ten’? Basically, “whatever it takes”, but less Draghi, more Volcker!
While there are inferences being drawn with a bunch of instances in the past when inversion led to a recession, I (not singularly) think 1994 (when inversion in some spreads didn’t lead to a recession) is a better parallel.
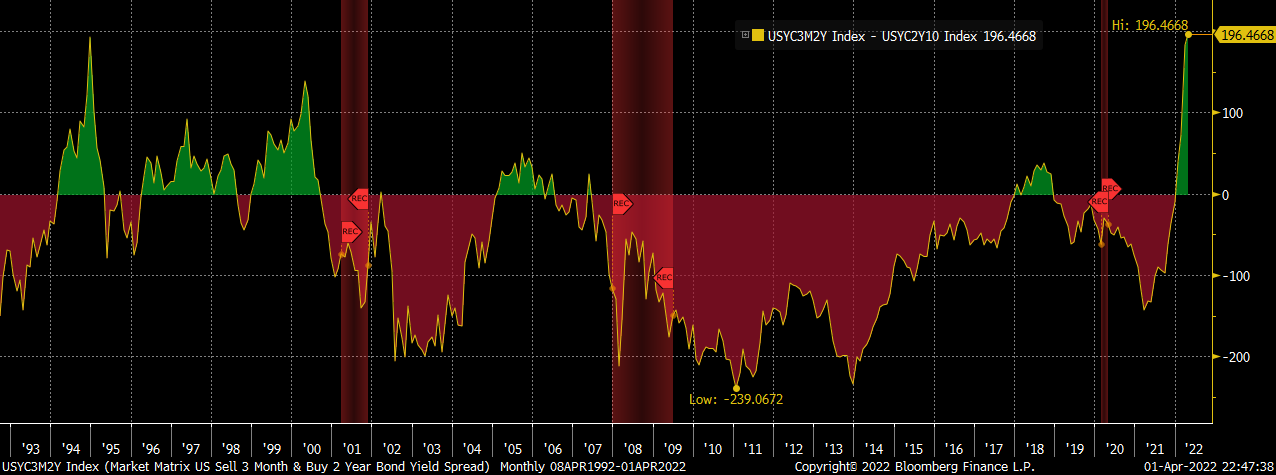
As we can see in this chart, the 3ms2s vs 2s10s spread (or the 3m2s10s fly) is the widest it has been since the end of 1994. The widening of this fly is indicative of the fact that while the Fed shifted its guidance from dovish to extremely hawkish, the policy is still accommodative. Others have phrased this differently by saying that 3m10s lead to recession more closely than other spreads, and the 3m10s spread is far from inverted. But if the market is right about how this plays out, even 3m10s is likely to invert by the end of this year. Why? Because soft landing is hard!

Meanwhile, it’s worth noting that the Treasury curve is just one of the many yield curves, and there are curves that remain more deeply inverted than the Treasury curve, but barely get any attention. Case in point: the OIS curve, where the inversion is far more visible. This happens because 30y Treasuries trade a lot cheaper versus 30y OIS than 10y Treasuries do versus 10y OIS. And as the Fed begins shrinking the balance sheet there is room for Treasuries to move further versus OIS, unless the Treasury decides to fund QT entirely by issuing bills. More on this next time.

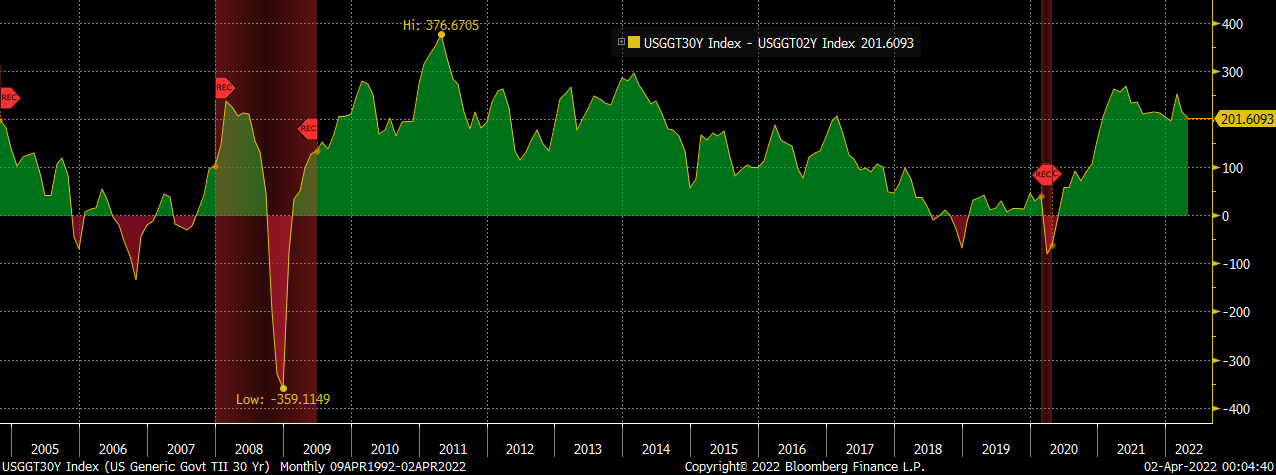
What makes this inversion really unique, however, is the shape of the inflation expectations curve. The rise and persistence in inflation has pushed short-term inflation expectations very high. At the same time, because the Fed is worried about these expectations becoming entrenched, they have had to frontload policy action aggressively, so as to bring inflation (and expectations) down over the medium term.

This directly leads to an inverted inflation expectations curve (see above), and also contributes to a flat/inverted nominal yield curve, because inflation expectations are a major determinant of nominal yields. Thus, while everyone frets about the 2s30s curve inverting for the first time since 2007, the “real” 2s30s spread is at 200bps!
We can therefore conclude with the following:
Yield curve inversions are an indication that the market expects the Fed to ease policy in the future, either in an effort to avoid a recession after having tightened policy too aggressively or, to fight an actual recession. But the inversion by itself doesn’t predict or cause a recession because it’s not always a result of overly tight policy and can happen for reasons like depressed term premia or incredibly high spot inflation.
As long as inflation remains a concern for the Fed, it’s difficult for the curve to steepen meaningfully because policy response will be frontloaded. Some have argued that ceasing the conflict could lead to steepening, though it’s not as straightforward. Yes, the war pushes inflation higher, requiring faster hikes (hence a flatter curve) but Fed’s Waller also argued that he would have proposed hiking by 50bps if not for the war. So the end of the war is, therefore, more likely to lead to higher real yield at the long end, than an outright steeper curve.
Traditional indicators of terminal rate like the 5y1m Forward OIS won’t work for this cycle, because the cycle may terminate in two years itself, or even one. Therefore, it should prove more useful to track 1y1m and compare that with the neutral rate projections from the Fed to determine whether the policy is accommodative or not.

Looking ahead, it would be interesting to hear from Fed’s Brainard on inflation. The minutes are likely to be stale other than the bit on the pace at which they aim to shrink the balance sheet. There is a very important BoC survey that may just determine whether we get a 50bps hike in April itself. Also, with March over, and bonds cheaper than they have been in a while, will the Japanese lifers (and others with real money) start buying again? And would it matter that US 10s not being as attractive versus German Bunds on an FX-adjusted basis as they were last year?

In terms of trade ideas, spreads that looked good last week should look great today? :) Most trades today have an implicit view of inflation/the war, and an understanding of what the market is willing to price in the near term. We all know that the reserve currency status of the US Dollar allows the US to borrow cheaply, as exporters recycle their reserves into Treasuries, and hence losing that status would mean higher yields. We also know that if Oil prices shot up to $200/barrel, we will see a significant rise in rates and a recession to follow. But unless we get some fresh evidence that we are going back to the 1970s, 1y1m should find some resistance around 3-3.25%. Thoughts?
Good to have you back Rishi. Courageous to try and catch the falling knife of fed expectations, and while at least there's a whack priced in, the data really hasn't softened nor has the inflation outlook tempered.... More watching ;-)